OPNFV Testing Overview
Introduction
Testing is one of the key activities in OPNFV and includes unit, feature, component, system level testing for development, automated deployment, performance characterization and stress testing.
Test projects are dedicated to provide frameworks, tooling and test-cases categorized as functional, performance or compliance testing. Test projects fulfill different roles such as verifying VIM functionality, benchmarking components and platforms or analysis of measured KPIs for OPNFV release scenarios.
Feature projects also provide their own test suites that either run independently or within a test project.
This document details the OPNFV testing ecosystem, describes common test components used by individual OPNFV projects and provides links to project specific documentation.
The OPNFV Testing Ecosystem
The OPNFV testing projects are represented in the following diagram:
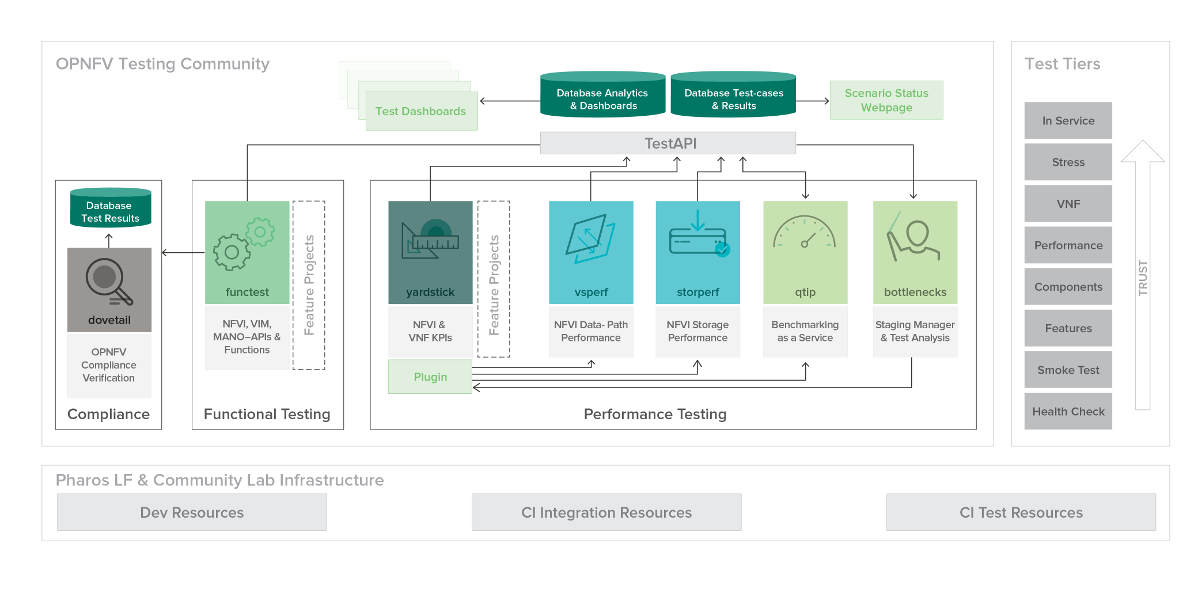
The major testing projects are described in the table below:
| Project | Description |
|---|---|
| Bottlenecks | This project aims to find system bottlenecks by testing and verifying OPNFV infrastructure in a staging environment before committing it to a production environment. Instead of debugging a deployment in production environment, an automatic method for executing benchmarks which plans to validate the deployment during staging is adopted. This project forms a staging framework to find bottlenecks and to do analysis of the OPNFV infrastructure. |
| CPerf | SDN Controller benchmarks and performance testing, applicable to controllers in general. Collaboration of upstream controller testing experts, external test tool developers and the standards community. Primarily contribute to upstream/external tooling, then add jobs to run those tools on OPNFV’s infrastructure. |
| Dovetail | This project intends to define and provide a set of OPNFV related validation criteria/tests that will provide input for the OPNFV Complaince Verification Program. The Dovetail project is executed with the guidance and oversight of the Complaince and Certification (C&C) committee and work to secure the goals of the C&C committee for each release. The project intends to incrementally define qualification criteria that establish the foundations of how one is able to measure the ability to utilize the OPNFV platform, how the platform itself should behave, and how applications may be deployed on the platform. |
| Functest | This project deals with the functional testing of the VIM and NFVI. It leverages several upstream test suites (OpenStack, ODL, ONOS, etc.) and can be used by feature project to launch feature test suites in CI/CD. The project is used for scenario validation. |
| NFVbench | NFVbench is a compact and self contained data plane performance measurement tool for OpensStack based NFVi platforms. It is agnostic of the NFVi distribution, Neutron networking implementation and hardware. It runs on any Linux server with a DPDK compliant NIC connected to the NFVi platform data plane and bundles a highly efficient software traffic generator. Provides a fully automated measurement of most common packet paths at any level of scale and load using RFC-2544. Available as a Docker container with simple command line and REST interfaces. Easy to use as it takes care of most of the guesswork generally associated to data plane benchmarking. Can run in any lab or in production environments. |
| QTIP | QTIP as the project for “Platform Performance Benchmarking” in OPNFV aims to provide user a simple indicator for performance, supported by comprehensive testing data and transparent calculation formula. It provides a platform with common services for performance benchmarking which helps users to build indicators by themselves with ease. |
| StorPerf | The purpose of this project is to provide a tool to measure block and object storage performance in an NFVI. When complemented with a characterization of typical VF storage performance requirements, it can provide pass/fail thresholds for test, staging, and production NFVI environments. |
| VSPERF | VSPERF is an OPNFV project that provides an automated test-framework and comprehensive test suite based on Industry Test Specifications for measuring NFVI data-plane performance. The data-path includes switching technologies with physical and virtual network interfaces. The VSPERF architecture is switch and traffic generator agnostic and test cases can be easily customized. Software versions and configurations including the vSwitch (OVS or VPP) as well as the network topology are controlled by VSPERF (independent of OpenStack). VSPERF is used as a development tool for optimizing switching technologies, qualification of packet processing components and for pre-deployment evaluation of the NFV platform data-path. |
| Yardstick | The goal of the Project is to verify the infrastructure compliance when running VNF applications. NFV Use Cases described in ETSI GS NFV 001 show a large variety of applications, each defining specific requirements and complex configuration on the underlying infrastructure and test tools.The Yardstick concept decomposes typical VNF work-load performance metrics into a number of characteristics/performance vectors, which each of them can be represented by distinct test-cases. |
Testing Working Group Resources
Test Results Collection Framework
Any test project running in the global OPNFV lab infrastructure and is integrated with OPNFV CI can push test results to the community Test Database using a common Test API. This database can be used to track the evolution of testing and analyse test runs to compare results across installers, scenarios and between technically and geographically diverse hardware environments.
Results from the databse are used to generate a dashboard with the current test status for each testing project. Please note that you can also deploy the Test Database and Test API locally in your own environment.
Overall Test Architecture
The management of test results can be summarized as follows:
+-------------+    +-------------+    +-------------+
|             |    |             |    |             |
|   Test      |    |   Test      |    |   Test      |
| Project #1  |    | Project #2  |    | Project #N  |
|             |    |             |    |             |
+-------------+    +-------------+    +-------------+
         |               |               |
         V               V               V
     +---------------------------------------------+
     |                                             |
     |           Test Rest API front end           |
     |    http://testresults.opnfv.org/test        |
     |                                             |
     +---------------------------------------------+
         ^                |                     ^
         |                V                     |
         |     +-------------------------+      |
         |     |                         |      |
         |     |    Test Results DB      |      |
         |     |         Mongo DB        |      |
         |     |                         |      |
         |     +-------------------------+      |
         |                                      |
         |                                      |
   +----------------------+        +----------------------+
   |                      |        |                      |
   | Testing Dashboards   |        |  Test Landing page   |
   |                      |        |                      |
   +----------------------+        +----------------------+
The Test Database
A Mongo DB Database was introduced for the Brahmaputra release. The following collections are declared in this database:
- pods: the list of pods used for production CI
- projects: the list of projects providing test cases
- test cases: the test cases related to a given project
- results: the results of the test cases
- scenarios: the OPNFV scenarios tested in CI
This database can be used by any project through the Test API. Please note that projects may also use additional databases. The Test Database is mainly use to collect CI test results and generate scenario trust indicators. The Test Database is also cloned for OPNFV Plugfests in order to provide a private datastore only accessible to Plugfest participants.
Test API description
The Test API is used to declare pods, projects, test cases and test results. Pods correspond to a cluster of machines (3 controller and 2 compute nodes in HA mode) used to run the tests and are defined in the Pharos project. The results pushed in the database are related to pods, projects and test cases. Trying to push results generated from a non-referenced pod will return an error message by the Test API.
- The data model is very basic, 5 objects are available:
- Pods
- Projects
- Test cases
- Results
- Scenarios
For detailed information, please go to http://artifacts.opnfv.org/releng/docs/testapi.html
The code of the Test API is hosted in the releng-testresults repository [TST2]. The static documentation of the Test API can be found at [TST3]. The Test API has been dockerized and may be installed locally in your lab.
The deployment of the Test API has been automated. A jenkins job manages:
- the unit tests of the Test API
- the creation of a new docker file
- the deployment of the new Test API
- the archive of the old Test API
- the backup of the Mongo DB
Test API Authorization
PUT/DELETE/POST operations of the TestAPI now require token based authorization. The token needs to be added in the request using a header ‘X-Auth-Token’ for access to the database.
e.g:
headers['X-Auth-Token']
The value of the header i.e the token can be accessed in the jenkins environment variable TestApiToken. The token value is added as a masked password.
headers['X-Auth-Token'] = os.environ.get('TestApiToken')
The above example is in Python. Token based authentication has been added so that only CI pods running Jenkins jobs can access the database. Please note that currently token authorization is implemented but is not yet enabled.
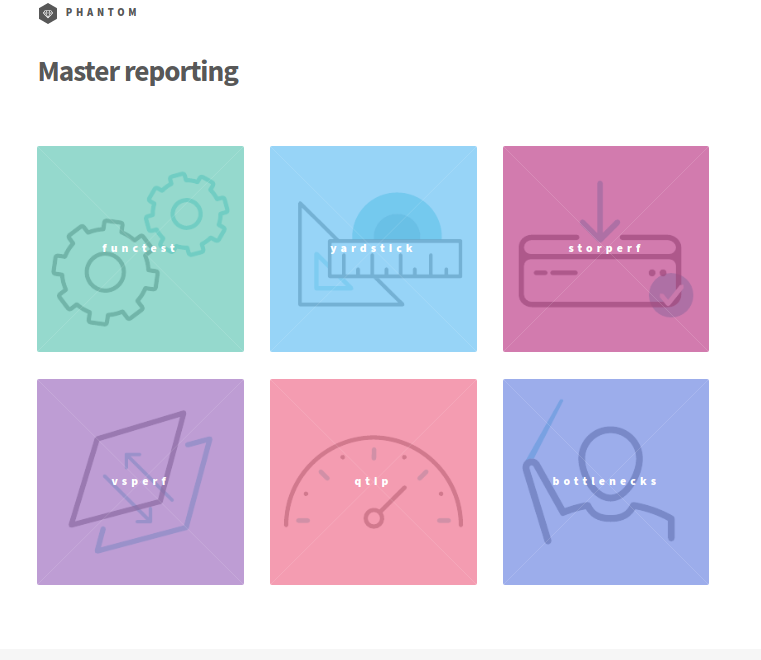
Test Project Reporting
The reporting page for the test projects is http://testresults.opnfv.org/reporting/
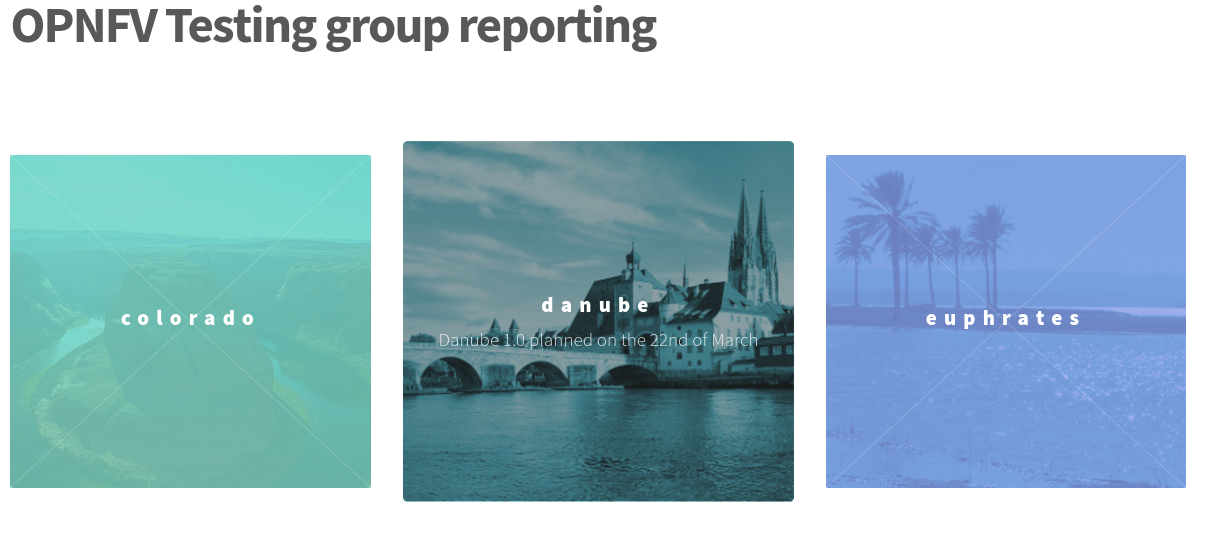
This page provides reporting per OPNFV release and per testing project.
An evolution of the reporting page is planned to unify test reporting by creating a landing page that shows the scenario status in one glance (this information was previously consolidated manually on a wiki page). The landing page will be displayed per scenario and show:
- the status of the deployment
- the score from each test suite. There is no overall score, it is determined by each test project.
- a trust indicator
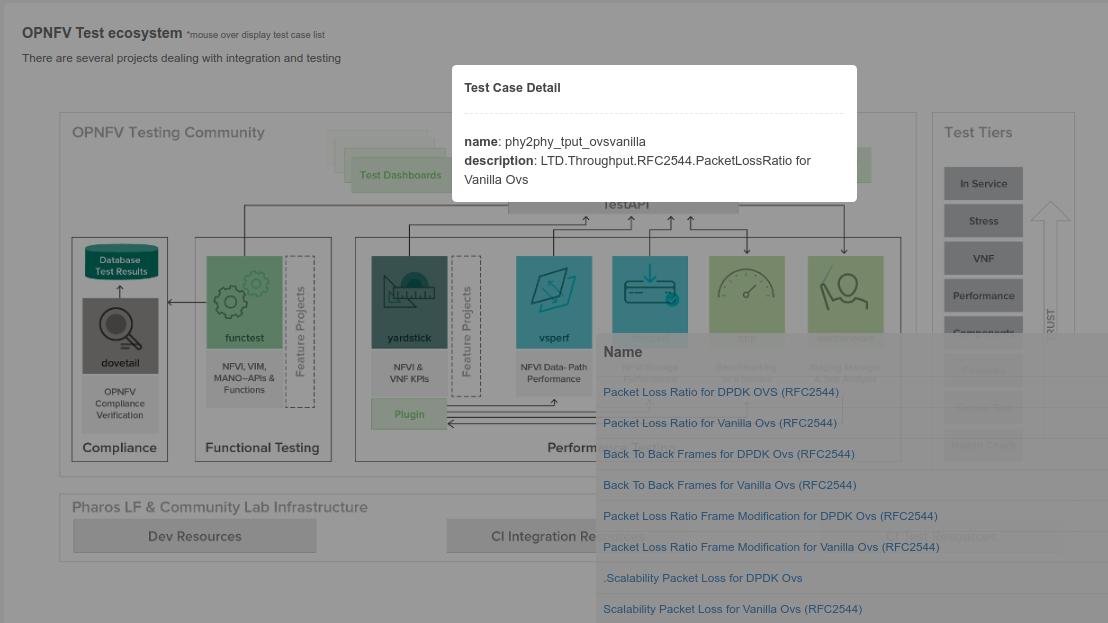
Test Case Catalog
Until the Colorado release, each testing project managed the list of its test cases. This made it very hard to have a global view of the available test cases from the different test projects. A common view was possible through the API but it was not very user friendly. Test cases per project may be listed by calling:
http://testresults.opnfv.org/test/api/v1/projects/<project_name>/cases
with project_name: bottlenecks, functest, qtip, storperf, vsperf, yardstick
A test case catalog has now been realized [TST4]. Roll over the project then click to get the list of test cases, and then click on the case to get more details.
Test Dashboards
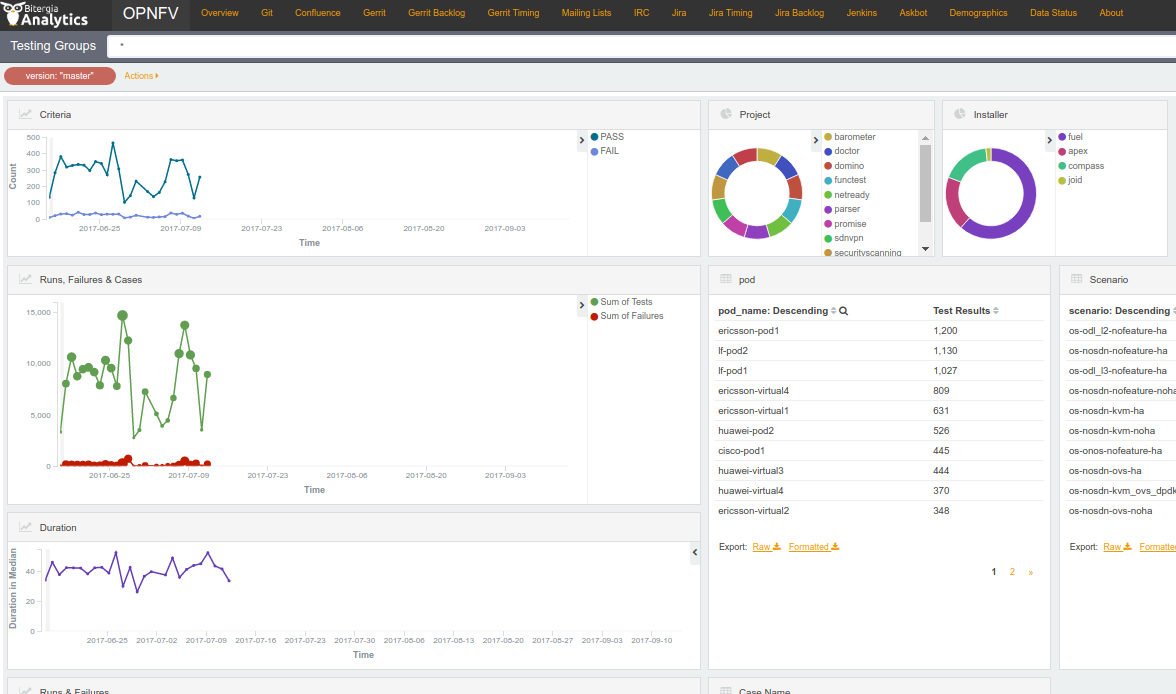
The Test Dashboard is used to provide a consistent view of the results collected in CI. The results shown on the dashboard are post processed from the Database, which only contains raw results. The dashboard can be used in addition to the reporting page (high level view) to allow the creation of specific graphs according to what the test owner wants to show.
In Brahmaputra, a basic dashboard was created in Functest. In Colorado, Yardstick used Grafana (time based graphs) and ELK (complex graphs). Since Danube, the OPNFV testing community decided to adopt the ELK framework and to use Bitergia for creating highly flexible dashboards [TST5].
Power Consumption Monitoring Framework
Introduction
Power consumption is a key driver for NFV. As an end user is interested to know which application is good or bad regarding power consumption and explains why he/she has to plug his/her smartphone every day, we would be interested to know which VNF is power consuming.
Power consumption is hard to evaluate empirically. It is however possible to collect information and leverage Pharos federation to try to detect some profiles/footprints. In fact thanks to CI, we know that we are running a known/deterministic list of cases. The idea is to correlate this knowledge with the power consumption to try at the end to find statistical biais.
High Level Architecture
The energy recorder high level architecture may be described as follows:
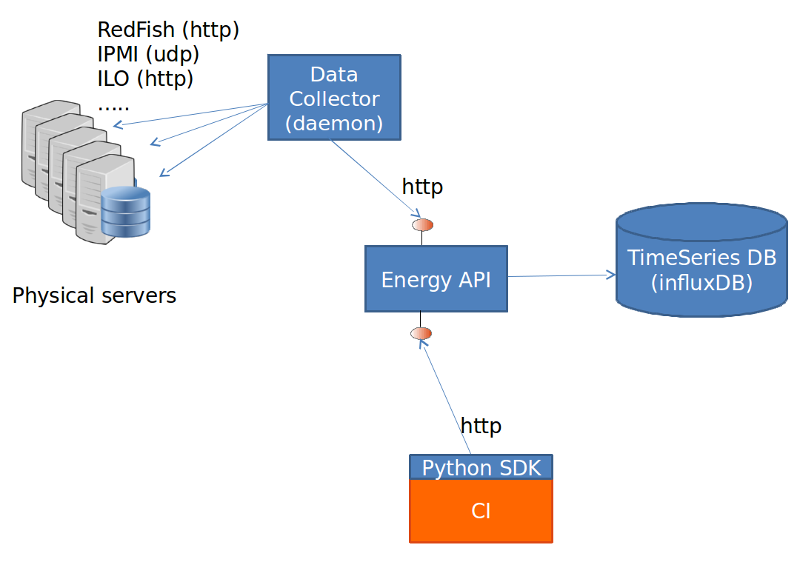
The energy monitoring system in based on 3 software components:
- Power info collector: poll server to collect instantaneous power consumption information
- Energy recording API + influxdb: On one leg receive servers consumption and on the other, scenarios notfication. It then able to establish te correlation between consumption and scenario and stores it into a time-series database (influxdb)
- Python SDK: A Python SDK using decorator to send notification to Energy recording API from testcases scenarios
Power Info Collector
It collects instantaneous power consumption information and send it to Event API in charge of data storing. The collector use different connector to read the power consumption on remote servers:
- IPMI: this is the basic method and is manufacturer dependent. Depending on manufacturer, refreshing delay may vary (generally for 10 to 30 sec.)
- RedFish: redfish is an industry RESTFUL API for hardware managment. Unfortunatly it is not yet supported by many suppliers.
- ILO: HP RESTFULL API: This connector support as well 2.1 as 2.4 version of HP-ILO
IPMI is supported by at least:
- HP
- IBM
- Dell
- Nokia
- Advantech
- Lenovo
- Huawei
Redfish API has been successfully tested on:
- HP
- Dell
- Huawei (E9000 class servers used in OPNFV Community Labs are IPMI 2.0 compliant and use Redfish login Interface through Browsers supporting JRE1.7/1.8)
Several test campaigns done with physical Wattmeter showed that IPMI results were notvery accurate but RedFish were. So if Redfish is available, it is highly recommended to use it.
Installation
To run the server power consumption collector agent, you need to deploy a docker container locally on your infrastructure.
This container requires:
- Connectivy on the LAN where server administration services (ILO, eDrac, IPMI,...) are configured and IP access to the POD’s servers
- Outgoing HTTP access to the Event API (internet)
Build the image by typing:
curl -s https://raw.githubusercontent.com/bherard/energyrecorder/master/docker/server-collector.dockerfile|docker build -t energyrecorder/collector -
Create local folder on your host for logs and config files:
mkdir -p /etc/energyrecorder
mkdir -p /var/log/energyrecorder
In /etc/energyrecorder create a configuration for logging in a file named collector-logging.conf:
curl -s https://raw.githubusercontent.com/bherard/energyrecorder/master/server-collector/conf/collector-logging.conf.sample > /etc/energyrecorder/collector-logging.conf
Check configuration for this file (folders, log levels.....) In /etc/energyrecorder create a configuration for the collector in a file named collector-settings.yaml:
curl -s https://raw.githubusercontent.com/bherard/energyrecorder/master/server-collector/conf/collector-settings.yaml.sample > /etc/energyrecorder/collector-settings.yaml
Define the “PODS” section and their “servers” section according to the environment to monitor. Note: The “environment” key should correspond to the pod name, as defined in the “NODE_NAME” environment variable by CI when running.
IMPORTANT NOTE: To apply a new configuration, you need to kill the running container an start a new one (see below)
Run
To run the container, you have to map folder located on the host to folders in the container (config, logs):
docker run -d --name energy-collector --restart=always -v /etc/energyrecorder:/usr/local/energyrecorder/server-collector/conf -v /var/log/energyrecorder:/var/log/energyrecorder energyrecorder/collector
Energy Recording API
An event API to insert contextual information when monitoring energy (e.g. start Functest, start Tempest, destroy VM, ..) It is associated with an influxDB to store the power consumption measures It is hosted on a shared environment with the folling access points:
| Component | Connectivity |
|---|---|
| Energy recording API documentation | http://energy.opnfv.fr/resources/doc/ |
| influxDB (data) | http://energy.opnfv.fr:8086 |
In you need, you can also host your own version of the Energy recording API (in such case, the Python SDK may requires a settings update) If you plan to use the default shared API, following steps are not required.
Image creation
First, you need to buid an image:
curl -s https://raw.githubusercontent.com/bherard/energyrecorder/master/docker/recording-api.dockerfile|docker build -t energyrecorder/api -
Setup
Create local folder on your host for logs and config files:
mkdir -p /etc/energyrecorder
mkdir -p /var/log/energyrecorder
mkdir -p /var/lib/influxdb
In /etc/energyrecorder create a configuration for logging in a file named webapp-logging.conf:
curl -s https://raw.githubusercontent.com/bherard/energyrecorder/master/recording-api/conf/webapp-logging.conf.sample > /etc/energyrecorder/webapp-logging.conf
Check configuration for this file (folders, log levels.....)
In /etc/energyrecorder create a configuration for the collector in a file named webapp-settings.yaml:
curl -s https://raw.githubusercontent.com/bherard/energyrecorder/master/recording-api/conf/webapp-settings.yaml.sample > /etc/energyrecorder/webapp-settings.yaml
Normaly included configuration is ready to use except username/passwer for influx (see run-container.sh bellow). Use here the admin user.
IMPORTANT NOTE: To apply a new configuration, you need to kill the running container an start a new one (see bellow)
Run
To run the container, you have to map folder located on the host to folders in the container (config, logs):
docker run -d --name energyrecorder-api -p 8086:8086 -p 8888:8888 -v /etc/energyrecorder:/usr/local/energyrecorder/web.py/conf -v /var/log/energyrecorder/:/var/log/energyrecorder -v /var/lib/influxdb:/var/lib/influxdb energyrecorder/webapp admin-influx-user-name admin-password readonly-influx-user-name user-password
with
| Parameter name | Description |
|---|---|
| admin-influx-user-name | Influx user with admin grants to create |
| admin-password | Influx password to set to admin user |
| readonly-influx-user-name | Influx user with readonly grants to create |
| user-password | Influx password to set to readonly user |
NOTE: Local folder /var/lib/influxdb is the location web influx data are stored. You may used anything else at your convience. Just remember to define this mapping properly when running the container.
Power consumption Python SDK
a Python SDK - almost not intrusive, based on python decorator to trigger call to the event API.
It is currently hosted in Functest repo but if other projects adopt it, a dedicated project could be created and/or it could be hosted in Releng.
How to use the SDK
import the energy library:
import functest.energy.energy as energy
Notify that you want power recording in your testcase:
@energy.enable_recording
def run(self):
    self.do_some_stuff1()
    self.do_some_stuff2()
If you want to register additional steps during the scenarios you can to it in 2 different ways.
Notify step on method definition:
@energy.set_step("step1")
def do_some_stuff1(self):
...
@energy.set_step("step2")
def do_some_stuff2(self):
Notify directly from code:
@energy.enable_recording
def run(self):
  Energy.set_step("step1")
  self.do_some_stuff1()
  ...
  Energy.set_step("step2")
  self.do_some_stuff2()
SDK Setting
Settings delivered in the project git are ready to use and assume that you will use the sahre energy recording API. If you want to use an other instance, you have to update the key “energy_recorder.api_url” in <FUNCTEST>/functest/ci/config_functest.yaml” by setting the proper hostname/IP
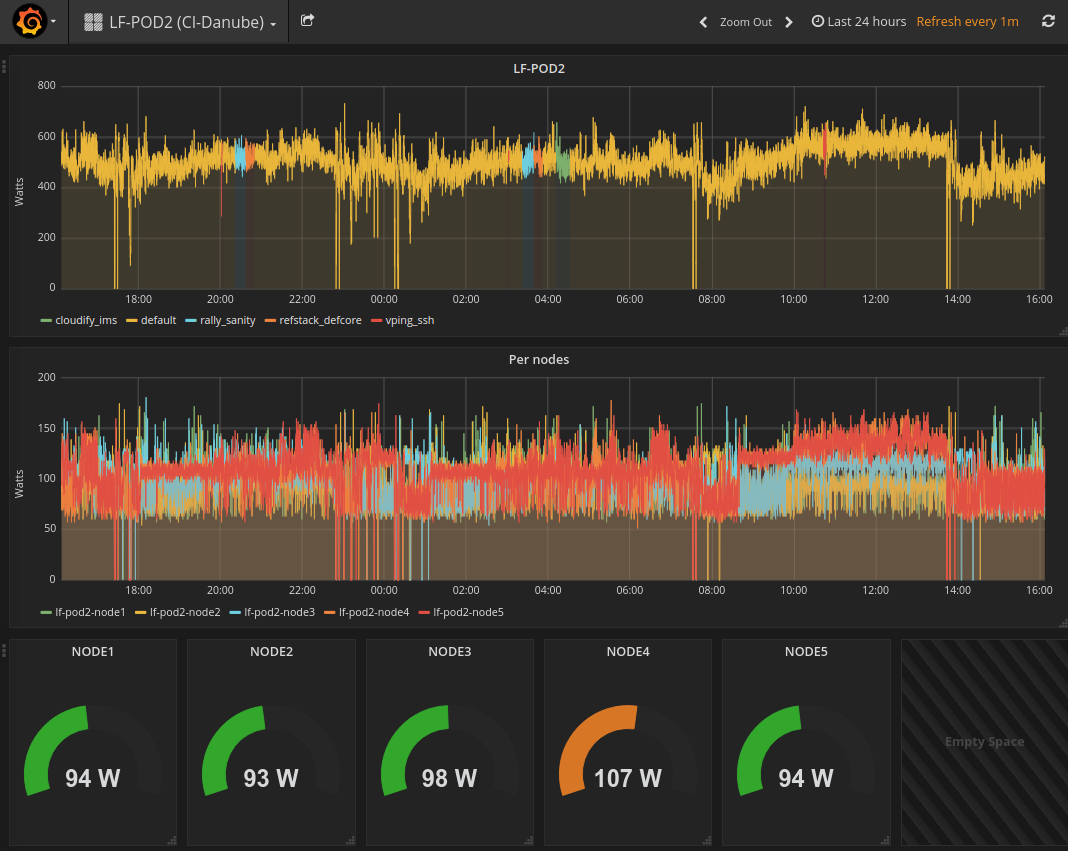
Results
Here is an example of result comming from LF POD2. This sequence represents several CI runs in a raw. (0 power corresponds to hard reboot of the servers)
You may connect http://energy.opnfv.fr:3000 for more results (ask for credentials to infra team).
OPNFV Test Group Information
For more information or to participate in the OPNFV test community please see the following:
wiki: https://wiki.opnfv.org/testing
mailing list: test-wg@lists.opnfv.org
IRC channel: #opnfv-testperf
- weekly meeting (https://wiki.opnfv.org/display/meetings/TestPerf):
- Usual time: Every Thursday 15:00-16:00 UTC / 7:00-8:00 PST
Reference Documentation
| Project | Documentation links |
|---|---|
| Bottlenecks | https://wiki.opnfv.org/display/bottlenecks/Bottlenecks |
| CPerf | https://wiki.opnfv.org/display/cperf |
| Dovetail | https://wiki.opnfv.org/display/dovetail |
| Functest | https://wiki.opnfv.org/display/functest/ |
| NFVbench | https://wiki.opnfv.org/display/nfvbench/ |
| QTIP | https://wiki.opnfv.org/display/qtip |
| StorPerf | https://wiki.opnfv.org/display/storperf/Storperf |
| VSPERF | https://wiki.opnfv.org/display/vsperf |
| Yardstick | https://wiki.opnfv.org/display/yardstick/Yardstick |
[TST1]: OPNFV web site
[TST2]: TestAPI code repository link in releng-testresults
[TST3]: TestAPI autogenerated documentation
[TST4]: Testcase catalog
[TST5]: Testing group dashboard