4.3. Logs User Guide
4.3.1. Prerequisites
Require 3 VMs to setup K8s
$ sudo yum install ansible$ pip install openshift pyyaml kubernetes(required for ansible K8s module)- Update IPs in all these files (if changed)
Path
Description
ansible-server/group_vars/all.ymlIP of K8s apiserver and VM hostname
ansible-server/hostsIP of VMs to install
ansible-server/roles/logging/files/persistentVolume.yamlIP of NFS-Server
ansible-server/roles/logging/files/elastalert/ealert-rule-cm.yamlIP of alert-receiver
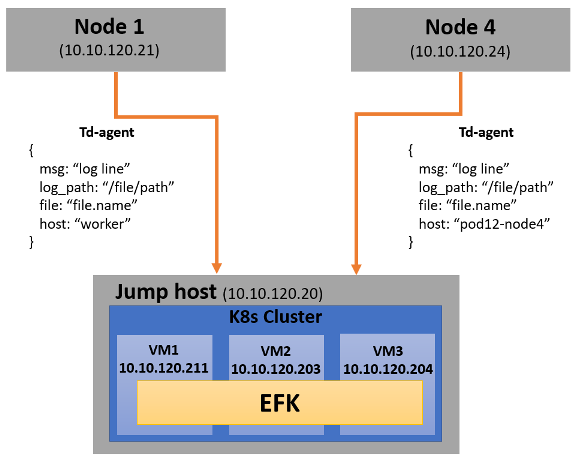
4.3.2. Architecture
4.3.3. Installation - Clientside
4.3.3.1. Nodes
Node1 = 10.10.120.21
Node4 = 10.10.120.24
4.3.3.2. How installation is done?
- TD-agent installation
$ curl -L https://toolbelt.treasuredata.com/sh/install-redhat-td-agent3.sh | sh
- Copy the TD-agent config file in Node1
$ cp tdagent-client-config/node1.conf /etc/td-agent/td-agent.conf
- Copy the TD-agent config file in Node4
$ cp tdagent-client-config/node4.conf /etc/td-agent/td-agent.conf
- Restart the service
$ sudo service td-agent restart
4.3.4. Installation - Serverside
4.3.4.1. Nodes
- Inside Jumphost - POD12
VM1 = 10.10.120.211
VM2 = 10.10.120.203
VM3 = 10.10.120.204
4.3.4.2. How installation is done?
- Using Ansible:
- K8s
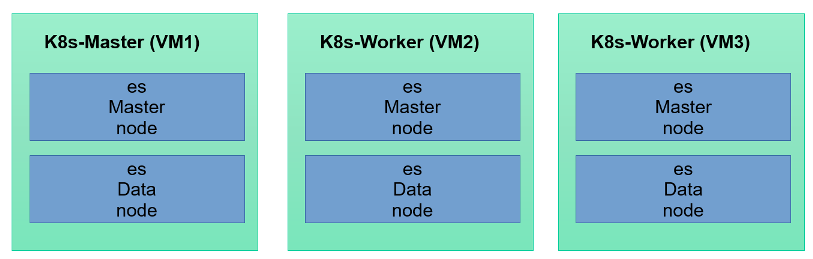
Elasticsearch: 1 Master & 1 Data node at each VM
Kibana: 1 Replicas
Nginx: 2 Replicas
Fluentd: 2 Replicas
Elastalert: 1 Replica (get duplicate alert, if increase replica)
- NFS Server: at each VM to store elasticsearch data at following path
/srv/nfs/master/srv/nfs/data
4.3.4.3. How to setup?
To setup K8s cluster and EFK: Run the ansible-playbook
ansible/playbooks/setup.yamlTo clean everything: Run the ansible-playbook
ansible/playbooks/clean.yaml
4.3.4.4. Do we have HA?
Yes
4.3.5. Configuration
4.3.5.1. K8s
4.3.5.1.1. Path of all yamls (Serverside)
ansible-server/roles/logging/files/
4.3.5.1.2. K8s namespace
logging
4.3.5.1.3. K8s Service details
$ kubectl get svc -n logging
4.3.5.2. Elasticsearch Configuration
4.3.5.2.1. Elasticsearch Setup Structure
4.3.5.2.2. Elasticsearch service details
logging-es-http9200ClusterIP4.3.5.2.3. How to get elasticsearch default username & password?
- User1 (custom user):
- Username:
elasticsearchPassword:password123
- User2 (by default created by Elastic Operator):
- Username:
elasticTo get default password:$ PASSWORD=$(kubectl get secret -n logging logging-es-elastic-user -o go-template='{{.data.elastic | base64decode}}')$ echo $PASSWORD
4.3.5.2.4. How to increase replica of any index?
4.3.5.2.5. Index Life
30 Days
4.3.5.3. Kibana Configuration
4.3.5.3.1. Kibana Service details
logging-kb-http5601ClusterIP4.3.5.4. Nginx Configuration
4.3.5.4.1. IP
The IP address with https. Ex: “10.10.120.211:32000”
4.3.5.4.2. Nginx Setup Structure
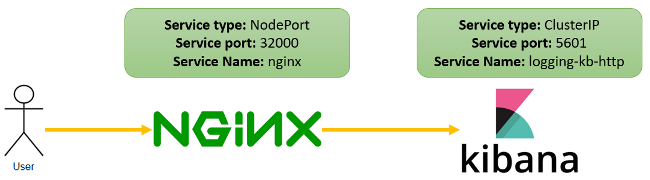
4.3.5.4.3. Ngnix Service details
nginx32000NodePort4.3.5.4.4. Why NGINX is used?
4.3.5.4.5. Nginx Configuration
Path: ansible-server/roles/logging/files/nginx/nginx-conf-cm.yaml
4.3.5.5. Fluentd Configuration - Clientside (Td-agent)
4.3.5.5.1. Fluentd Setup Structure
4.3.5.5.2. Log collection paths
/tmp/result*/*.log/tmp/result*/*.dat/tmp/result*/*.csv/tmp/result*/stc-liveresults.dat.*/var/log/userspace*.log/var/log/sriovdp/*.log.*/var/log/pods/**/*.log
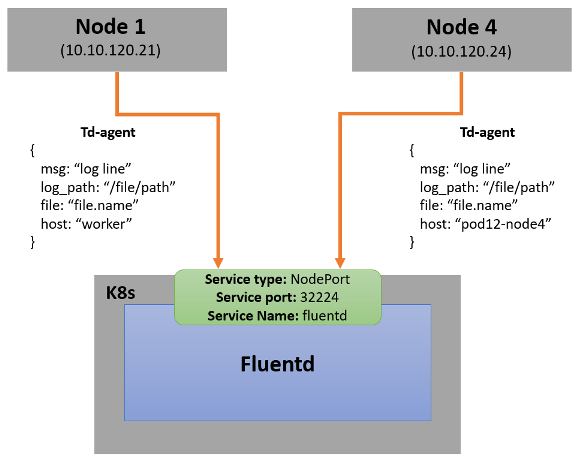
4.3.5.5.3. Logs sent to
Another fluentd instance of K8s cluster (K8s Master: 10.10.120.211) at Jumphost.
4.3.5.5.4. Td-agent logs
Path of td-agent logs: /var/log/td-agent/td-agent.log
4.3.5.5.5. Td-agent configuration
/etc/td-agent/td-agent.conf$ sudo service td-agent restart4.3.5.5.6. Config Description
Get the logs from collection path
- Convert to this format{msg: “log line”log_path: “/file/path”file: “file.name”host: “pod12-node4”}
Sends it to fluentd
4.3.5.6. Fluentd Configuration - Serverside
4.3.5.6.1. Fluentd Setup Structure
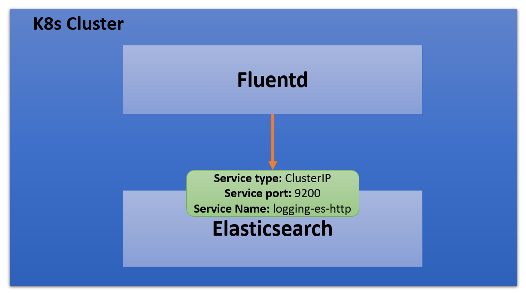
4.3.5.6.2. Fluentd Service details
fluentd32224NodePort4.3.5.6.3. Logs sent to
Elasticsearch service (Example: logging-es-http at port 9200)
4.3.5.6.4. Config Description
- Step 1
Get the logs from Node1 & Node4
- Step 2
log_path
add tag (for routing)
/tmp/result.*/.*errors.daterrordat.log
/tmp/result.*/.*counts.datcountdat.log
/tmp/result.*/stc-liveresults.dat.txstcdattx.log
/tmp/result.*/stc-liveresults.dat.rxstcdatrx.log
/tmp/result.*/.*Statistics.csvixia.log
/tmp/result.*/vsperf-overall*vsperf.log
/tmp/result.*/vswitchd*vswitchd.log
/var/log/userspace*userspace.log
/var/log/sriovdp*sriovdp.log
/var/log/pods*pods.log
- Step 3
- Then parse each type using tags.
error.conf: to find any error
time-series.conf: to parse time series data
time-analysis.conf: to calculate time analyasis
- Step 4
host
add tag (for routing)
pod12-node4node4
workernode1
- Step 5
Tag
elasticsearch
node4index “node4*”
node1index “node1*”
4.3.6. Elastalert
4.3.6.1. Send alert if
- Blacklist
“Failed to run test”
“Failed to execute in ‘30’ seconds”
“(‘Result’, ‘Failed’)”
“could not open socket: connection refused”
“Input/output error”
“dpdk|ERR|EAL: Error - exiting with code: 1”
“Failed to execute in ‘30’ seconds”
“dpdk|ERR|EAL: Driver cannot attach the device”
“dpdk|EMER|Cannot create lock on”
“dpdk|ERR|VHOST_CONFIG: * device not found”
- Time
vswitch_duration > 3 sec
4.3.6.2. How to configure alert?
- Add your rule in
ansible/roles/logging/files/elastalert/ealert-rule-cm.yaml(Elastalert Rule Config) - name: anythingtype: <check-above-link> #The RuleType to useindex: node4* #index namerealert:minutes: 0 #to get alert for all cases after each intervalalert: post #To send alert as HTTP POSThttp_post_url: # Provide URL
- Add your rule in
Mount this file to elastalert pod in
ansible/roles/logging/files/elastalert/elastalert.yaml.
4.3.6.3. Alert Format
{“type”: “pattern-match”, “label”: “failed”, “index”: “node4-20200815”, “log”: “error-log-line”, “log-path”: “/tmp/result/file.log”, “reson”: “error-message” }
4.3.7. Data Management
4.3.7.1. Elasticsearch
4.3.7.1.1. Q&As
Where data is stored now? Data is stored in NFS server with 1 replica of each index (default). Path of data are following:
/srv/nfs/data (VM1)
/srv/nfs/data (VM2)
/srv/nfs/data (VM3)
/srv/nfs/master (VM1)
/srv/nfs/master (VM2)
/srv/nfs/master (VM3)
If user wants to change from NFS to local storage, can he do it?
Yes, user can do this, need to configure persistent volume. (ansible-server/roles/logging/files/persistentVolume.yaml)
Do we have backup of data? Yes. 1 replica of each index
When K8s restart, the data is still accessible? Yes (If data is not deleted from /srv/nfs/data)
4.3.8. Troubleshooting
4.3.8.1. If no logs receiving in Elasticsearch
Check IP & port of server-fluentd in client config.
Check client-fluentd logs,
$ sudo tail -f /var/log/td-agent/td-agent.logCheck server-fluentd logs,
$ sudo kubectl logs -n logging <fluentd-pod-name>
4.3.8.2. If no notification received
Search your “log” in Elasticsearch.
Check config of elastalert
Check IP of alert-receiver